
Re-introducing prawn-graph - it's back! Simple graphing for PDF and Ruby


There might be a slight sense of déjà vu about this topic, since a few years ago on my old blog I wrote a similar thing. That time it was an attempt to motivate me to actually make an update to prawn-graph. This time, it actually is updated.
Over 6 years ago, I released a Ruby gem which extended the prawn PDF library to allow it to draw some graphs / charts natively without the need to fill up your PDF document with huge blobs of image data.
Over time, I let the project grow a little abandoned. It became incompatible with newer versions of prawn and had some pretty annoying bugs in it.
In the past month, a brand new version of prawn-graph has been released. It's not backwards-compatible with the old version, but also introduces a totally new renderer which is a work in progress, but is already way better.
The license has also changed from LGPL to MIT, which I hope will make it easier for people to use prawn-graph in their own projects.
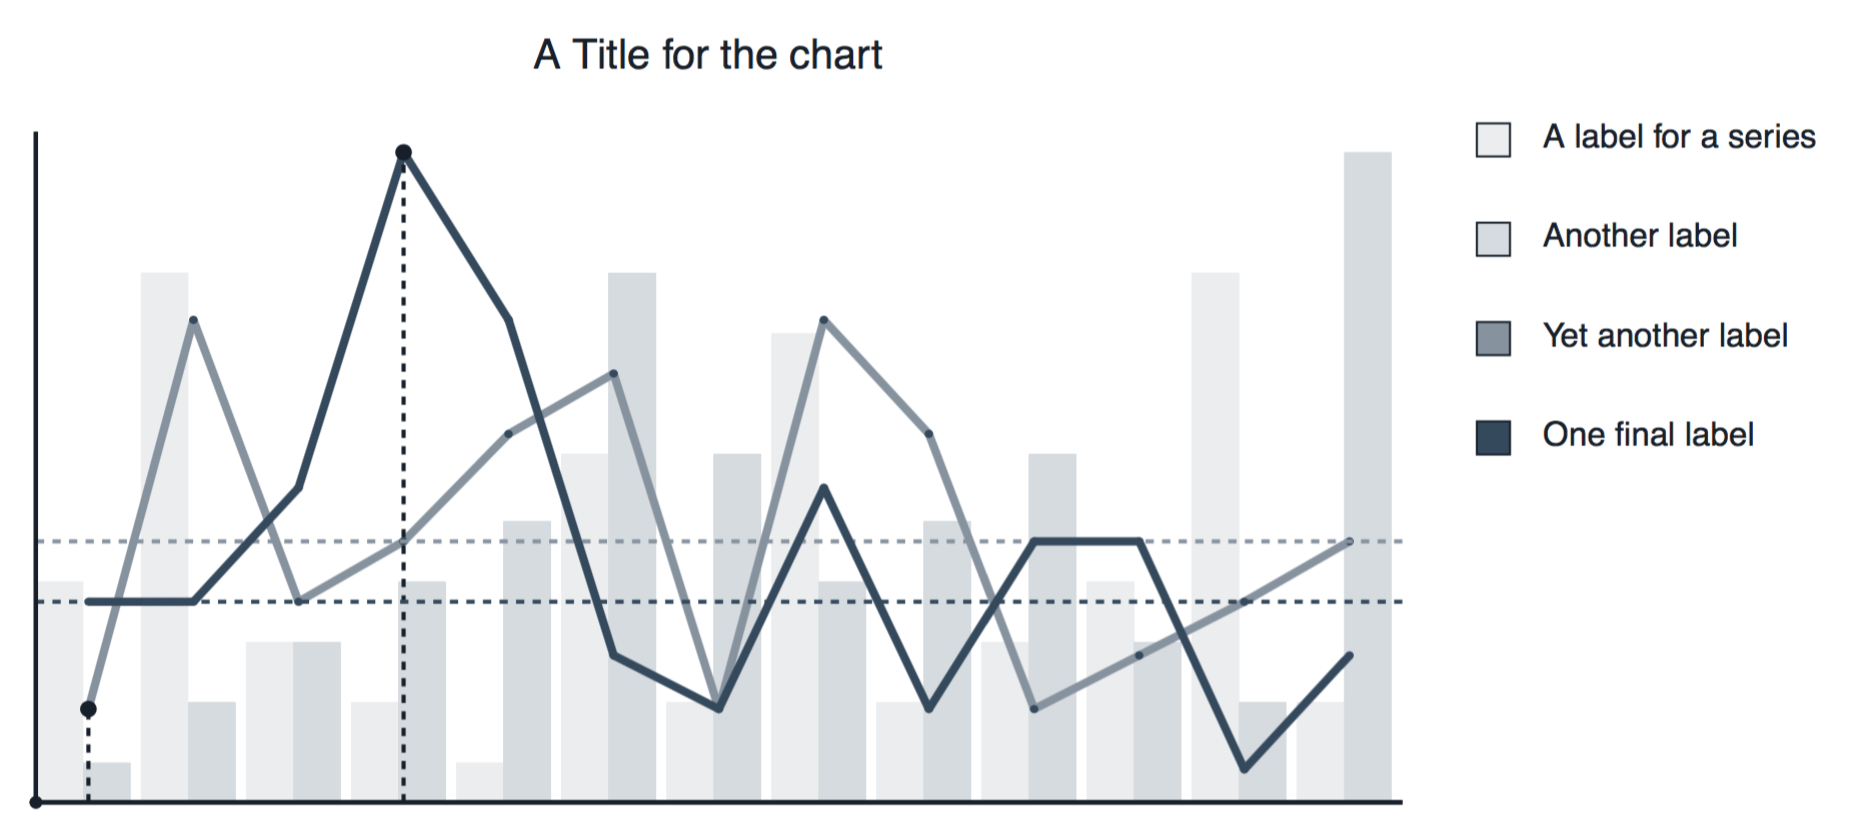
The column charts and line charts are already greatly improved. You can see an example below:
For more details please check out the website, try it out, and report any bugs that you find on GitHub.